볼린저밴드
def bollinger_band(data, w = 20, k = 2):
    data = data.copy()
    mbb = data['close'].rolling(w).mean()
    ubb = mbb + k * data['close'].rolling(w).std()
    lbb = mbb - k * data['close'].rolling(w).std()
    data['width'] = ubb - lbb

    # 볼린저 밴드에서 종가 위치
    data['bollinger_band'] = (data['close'] - lbb) / data['width']

    # 볼린저 밴드 넓이 증가량
    data['bollinger_band_ratio'] = np.zeros(len(data))
    data.loc[1:, 'bollinger_band_ratio']= (data['width'][1:].values - data['width'][:-1].values) / data['width'][:-1].values

    data.drop(['width'], axis = 1, inplace = True)

    return data
MACD
def cal_MACD(data, num_long=12, num_short=26, num_signal=9):
    data = data.copy()
    ema_long = data['close'].ewm(span=num_long, min_periods=num_long - 1).mean()
    ema_short = data['close'].ewm(span=num_short, min_periods=num_short - 1).mean()
    MACD = ema_long - ema_short
    MACD_signal = MACD.ewm(span=num_signal, min_periods=num_signal - 1).mean()
    data['MACD_diff'] = MACD - MACD_signal

    # MACD cross
    data['MACD_cross'] = pd.Series(np.where(data['MACD_diff'] >= 0, 1, -1), index=data.index)
    # 지난 MACD 대비 MACD 비율
    data['MACD_lastMACD_ratio'] = np.zeros(len(data))
    data.loc[1:, 'MACD_lastMACD_ratio'] = (data['MACD_diff'][1:].values - data['MACD_diff'][:-1].values) / data[
                                                                                                               'MACD_diff'][
                                                                                                           :-1].values

    data.drop('MACD_diff', axis=1, inplace=True)

    return data
RSI
def cal_RSI(data, period = 9):
    data = data.copy()

    U = np.where(data['close'].diff(1) > 0, data['close'].diff(1), 0)
    D = np.where(data['close'].diff(1) < 0, data['close'].diff(1) * (-1), 0)

    AU = pd.Series(U, index = data.index).rolling(window=period, min_periods=period).mean()
    AD = pd.Series(D, index = data.index).rolling(window=period, min_periods=period).mean()
    RS = AU / AD
    data['RSI'] = 1 - 1 / (1 + RS)

    return data
Stochastic Oscilator
def cal_stochastic_oscillator(data, n = 5):
    data = data.copy()
    size = len(data)
    temp=[]
    for i in range(size):
        if i >= n-1:
            tempUp = data['close'][i] - min(data['low'][i-n+1:i+1])
            tempDown = max(data['high'][i-n+1:i+1]) -  min(data['low'][i-n+1:i+1])
            if tempDown == 0:
                tempDown = 0.001
            temp.append(tempUp / tempDown)
        else:
            temp.append(0) #n보다 작은 초기값은 0 설정
    data['sto_K'] = pd.Series(temp,  index=data.index)
    data['sto_D'] = data['sto_K'].rolling(3).mean()
    return data
OBV
def cal_OBV(data, n=9):
    data = data.copy()
    OBV = []
    OBV.append(data['volume'][0])
    for i in range(1, len(data)):
        if data['close'][i] > data['close'][i - 1]:
            OBV.append(OBV[-1] + data['volume'][i])
        elif data['close'][i] < data['close'][i - 1]:
            OBV.append(OBV[-1] - data['volume'][i])
        else:
            OBV.append(OBV[-1])
    OBV = pd.Series(OBV, index=data.index)
    data['OBV_ewm'] = OBV.ewm(n).mean()

    # OBV signal
    data['OBV_cross'] = pd.Series(np.where(OBV >= data['OBV_ewm'], 1,-1), index = data.index)

    # 지난 OBV_ewm 대비 OBV_ewm 비율
    data['OBV_lastOBV_ratio'] = np.zeros(len(data))
    data.loc[1:, 'OBV_lastOBV_ratio'] = (data['OBV_ewm'][1:].values - data['OBV_ewm'][:-1].values) / data['OBV_ewm'][
                                                                                                     :-1].values

    data.drop('OBV_ewm', axis=1, inplace=True)

    return data
Log Return
def cal_log_return(data):
    data = data.copy()
    data['log_return'] = np.zeros(len(data))
    data['log_return'] = np.log(data['close'] / data['close'].shift(1))
    return data
'기타' 카테고리의 다른 글
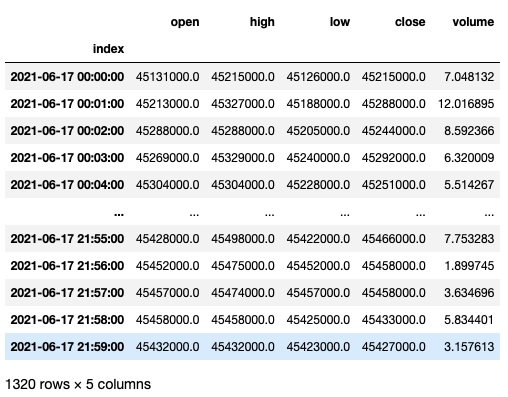
| 비트코인 분봉 데이터 가져오기 (0) | 2021.06.17 |
|---|---|
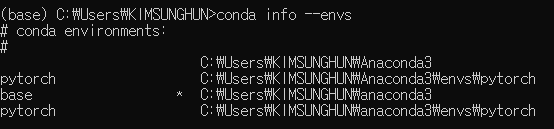
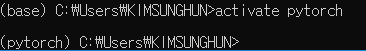
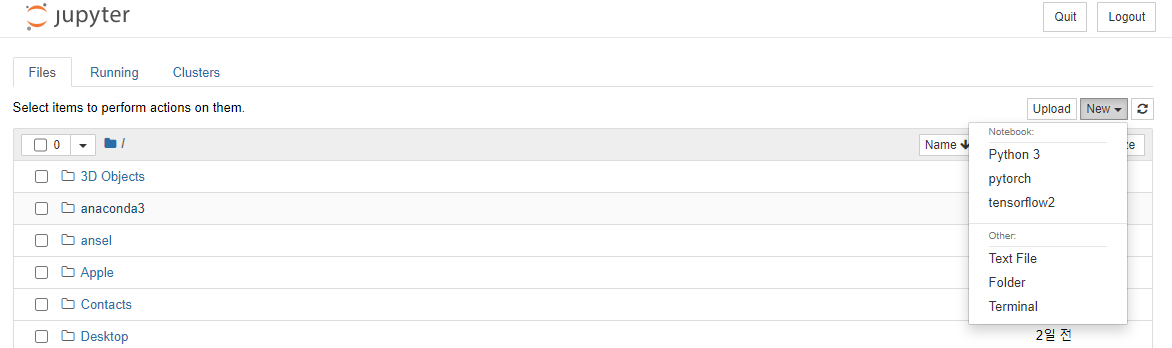
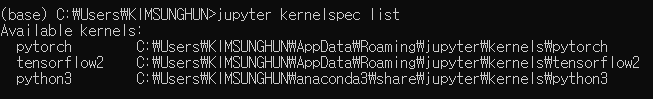
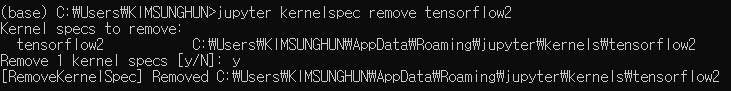
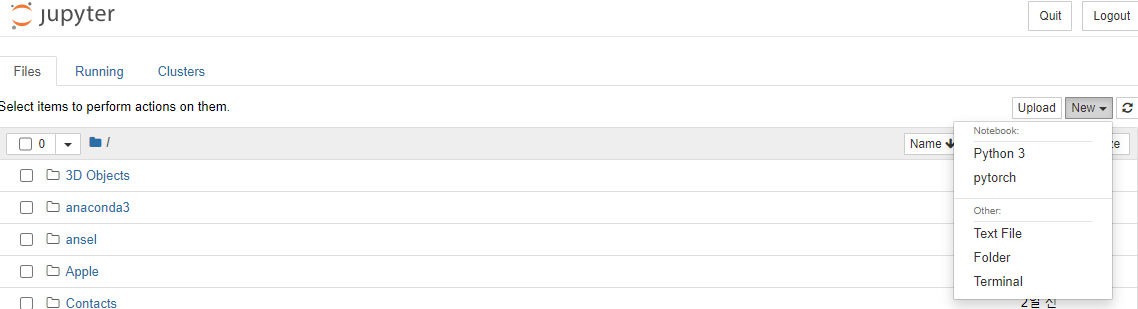
| Anaconda, Jupyter notebook 가상환경 만들기 (0) | 2020.06.15 |
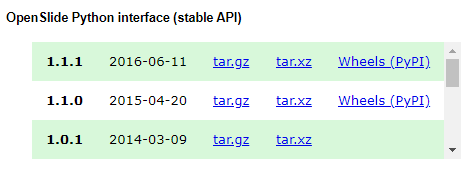
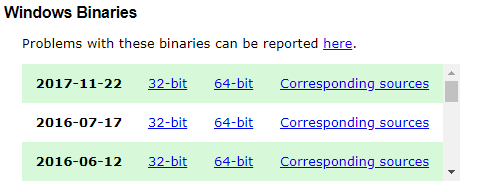
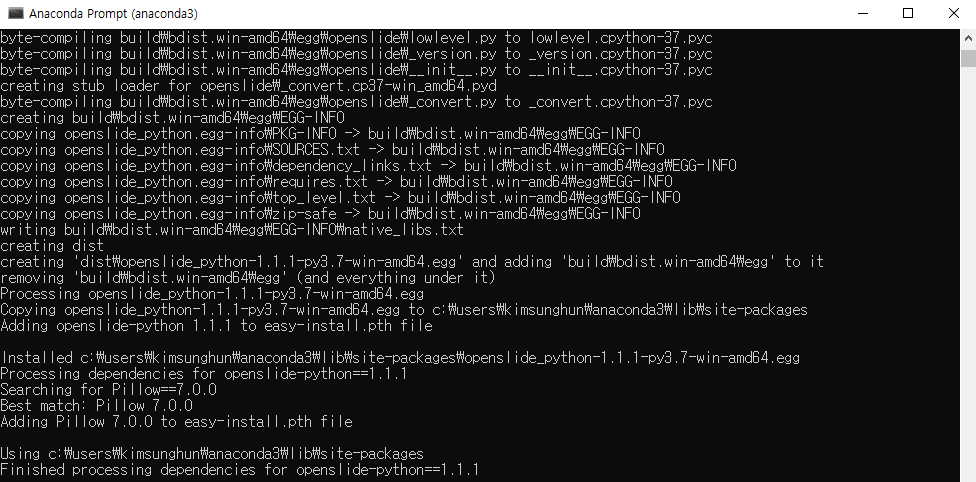
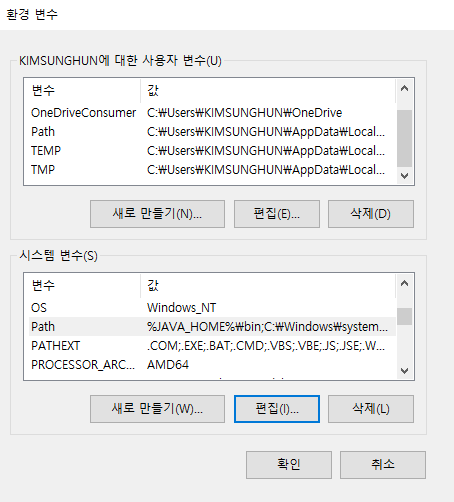
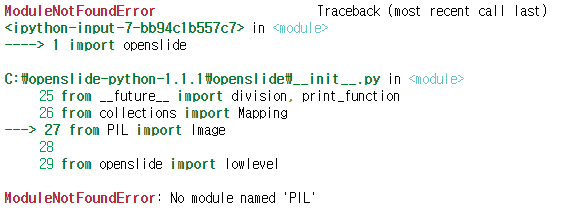
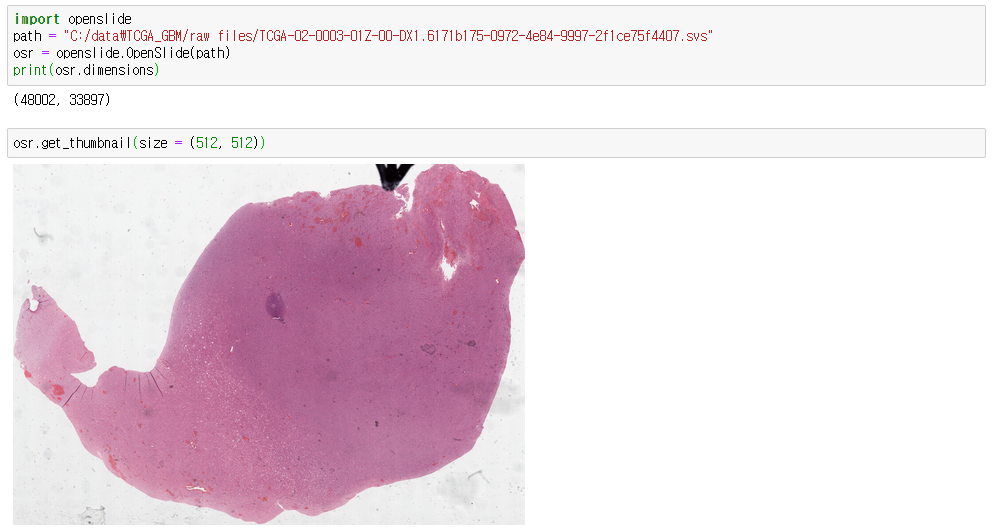
| python openslide 설치법 (0) | 2020.06.15 |